
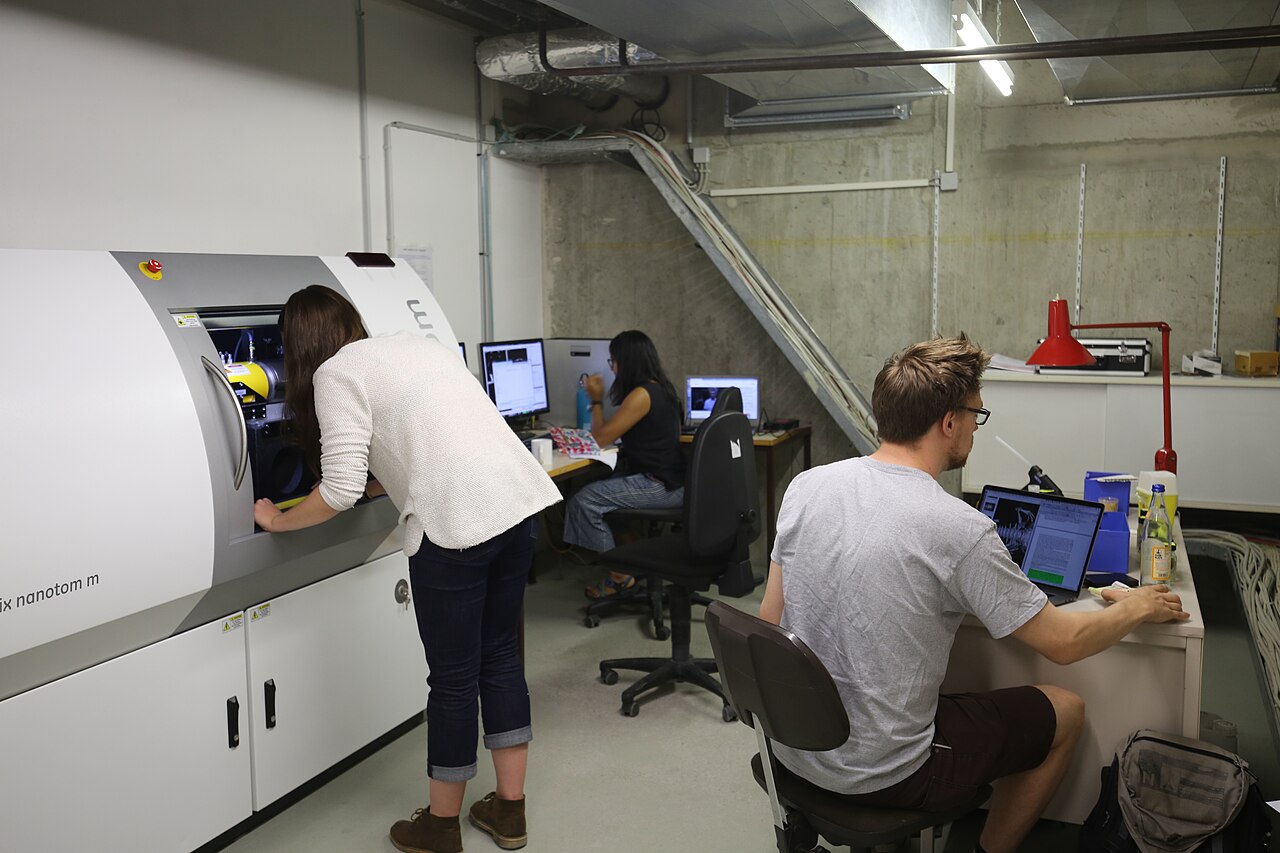
Math2Market launched GeoDict Quantify on September 29, 2026, at its Innovation Conference in Frankfurt, and the product page describes it as an entry package with a fixed combination of modules for analyzing micro-CT and FIB-SEM data. The pitch is narrow and deliberate: take the image-analysis half of a large simulation platform, lock the configuration, and make the results repeatable. For anyone who prints metal parts and has to prove what is inside them, that is a more interesting proposition than another segmentation demo.
Most makers will never own a micro-CT scanner, and Quantify will not change that. But the way porosity and defects get measured in printed metal is increasingly the thing that decides whether a part is accepted or scrapped, so the tooling behind those numbers matters even at a distance.
What is actually in the box
According to VoxelMatters, which published its report on September 30, the package consists of ten GeoDict modules. It covers image analysis only and cannot be directly expanded with simulation modules. Math2Market's own page, however, says the package can be upgraded to the full GeoDict platform, which adds digital-twin generation and multiphysics simulation. The two statements fit together: the entry package itself stays fixed, and the route to more capability is a move to the full product, not a bolt-on.
The processing chain follows the usual micro-CT sequence. Quantify handles artifact correction, denoising and alignment before segmentation. Segmentation comes in both conventional and AI-assisted forms, and the product page specifically mentions fast full 3D U-Net training. That matters because segmentation, deciding which voxels are material and which are void, is where most analysis variability enters. A pore that one operator thresholds in and another thresholds out changes every downstream number.
Once a volume is segmented, the software quantifies porosity, pore networks, fibers, particles, grains, wall thickness, orientation, connectivity, tortuosity and anisotropy. It also detects defects and dimensional deviations. Results come out as standardized reports, 3D visualizations and animations, and meshes and CAD files can be exported, Quality Magazine notes in its new-product listing.
Recipes, not clicks
The feature that explains the product's positioning is the "recipe." Every processing step is captured as a reusable workflow, so the same sequence can be applied to the next scan, or to the next batch, without an operator reconstructing it from memory. Macros and Python scripting sit alongside this for teams that want to automate or extend the workflow.
Anton du Plessis, head of image processing and image analysis at Math2Market, stresses reliable results in the coverage of the launch. In the Quality Magazine listing he is quoted saying the package "provides an accessible way to obtain reliable quantitative results, with the option to upgrade to the full GeoDict platform as requirements develop." The emphasis on "reliable" and "accessible" is a clue to the target buyer: a lab or production facility that has a scanner and needs consistent numbers from it, not necessarily a simulation specialist.
The AM examples
VoxelMatters cites two additive manufacturing examples. In the first, a sample from the University of Twente showed a dominant wall thickness of around 0.9 mm, with secondary peaks at 1.2 and 1.4 mm. A histogram like that is a quick way to see whether a thin-walled lattice or structure came out as designed, and where it deviated.
In the second, a 10 mm metal cube had its pores characterized by size, elongation and sphericity, with pores up to 0.277 mm in diameter. Those three descriptors are the ones that tend to matter in practice. Large, elongated, irregular voids are generally treated as more worrying than small, round ones, and a tool that reports all three from a single recipe makes it easier to compare one build against another.
These are vendor-selected examples, and the sources give no accuracy figures, validation data or benchmark comparisons against other analysis software. That is worth keeping in mind when reading the claims.
Sold through OEMs, with no price
Quantify is available exclusively through selected OEM partners, meaning makers of micro-CT and FIB-SEM systems. VoxelMatters says Math2Market lists Carl Zeiss, Rigaku, ProCon X-Ray and Bruker among its OEM partners for the GeoDict platform. You will not be able to buy it directly from Math2Market, and VoxelMatters adds that labs already owning a scanner cannot buy Quantify standalone; they are offered a demonstration and the same functionality within a standard GeoDict configuration. Pricing is not public: the product page says only that it is "competitively priced," and VoxelMatters reports that no price was disclosed.
The OEM route makes sense for a package built around a fixed configuration. VoxelMatters describes the software as typically bundled with a new imaging system, so the buyer gets a known set of modules instead of assembling a license list. It also means the practical question of cost will likely be answered by a quote from a scanner maker, not a price list.
Math2Market is not a newcomer. VoxelMatters notes it was founded in 2011 as a Fraunhofer ITWM spin-off, and that GeoDict has been in development since 2001. That history helps explain why a product like this can be assembled by carving a subset out of an existing platform.
Not built just for AM
An important caveat: the manufacturer itself says Quantify was not developed exclusively for additive manufacturing. The module list bears that out. Fibers, grains, particles and tortuosity are concerns of composites, batteries, filters and geological samples as much as printed parts, and the product page lists all of those among its applications. AM is one application among several.
That generality cuts both ways. The analysis methods are mature and broadly applied, which is reassuring. But nothing in the available material suggests AM-specific features such as build-orientation-aware defect classification or integration with slicer or build data. Users should treat it as a general quantification toolkit that happens to handle printed-metal porosity well, not as a print-process tool.
What It Means for Makers
For hobbyist and small-shop makers, the direct impact is close to zero. There is no public price, no direct sales channel, and the target hardware is a scanner most shops will never own. If you print metal through a service bureau, though, this class of software is what sits behind a porosity report or a defect certificate, and a standardized, scriptable workflow is a better basis for comparing suppliers than an opaque one-off analysis.
The more useful takeaway is about method. Reproducibility in inspection comes from capturing every step, from denoising to segmentation to measurement, in a form someone else can rerun. If you are asking a vendor for CT data on a part, ask how the segmentation was done and whether the workflow is documented. Quantify's recipe approach is one answer to that question, and the claim will be easiest to judge once independent users, not the vendor, publish results.
